
Data-first overview of the challenge
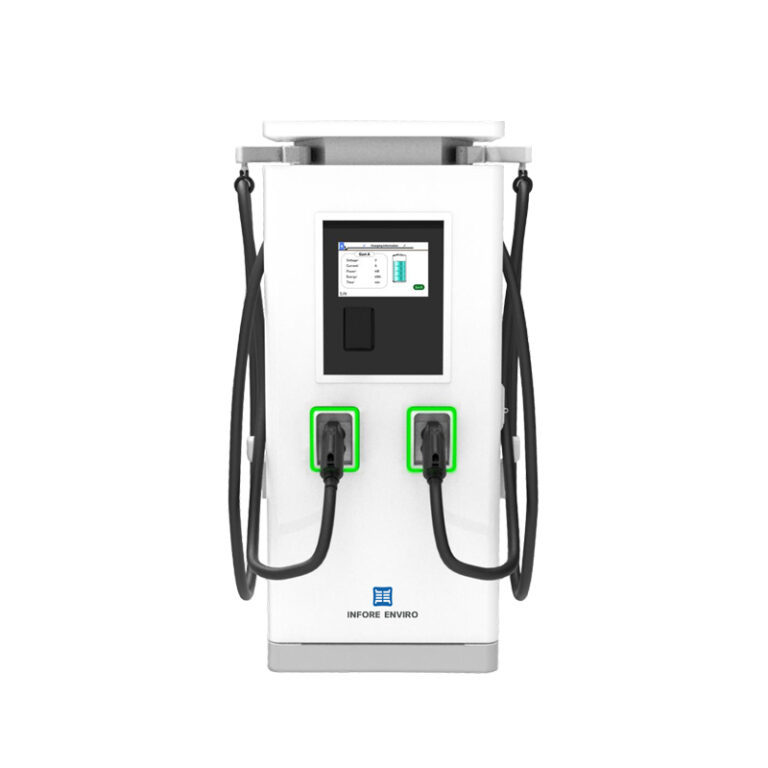
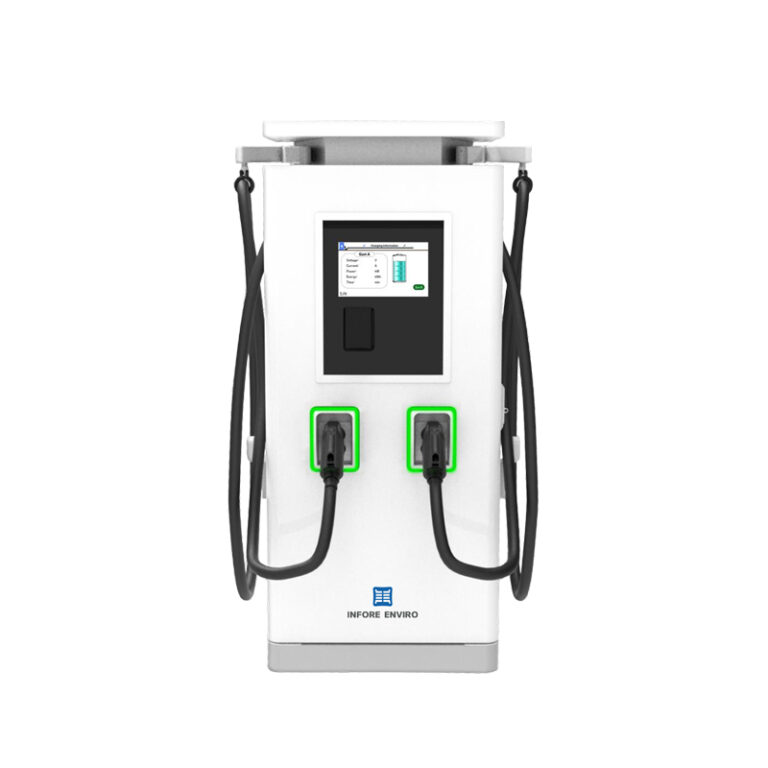
Fleet directors measure success in vehicle-kilometers, turnaround time and total cost of ownership; charging strategy sits at the intersection of those KPIs. Recent municipal targets—California’s plan to require zero-emission new car sales by 2035—force fleets to convert at scale. Operationally, that means integrating mixed-power hardware such as an AC DC charger into depot and public locations while planning for EV destination charging across routes and stops.
Quantifying fleet needs: metrics that drive decisions
An analytical approach starts with three metrics: average daily energy per vehicle (kWh), peak simultaneous charge events, and required turnaround window (hours). For a typical light-duty urban fleet, 60–80 kWh/day with two to three peak chargers produces predictable load profiles. Designing for a 98–99% charger uptime target and a median charge power between 11–22 kW for destination stops dramatically reduces risk of missed dispatches; for longer layovers, adding 50–60 kW DC fast charging lowers required charger dwell time by roughly 60% versus AC-only scenarios.
How wallbox installations scale operationally
Wallbox-style AC chargers are modular, low-footprint, and cost-effective per unit, which lets planners deploy incrementally by route cluster. Combine wallboxes with integrated AC/DC units at key nodes to balance cost and speed. This hybrid topology (distributed AC for overnight and mid-day destination charging; centralized DC for rapid turnarounds) reduces capital intensity while preserving flexibility. Load balancing and simple control logic keep transformer and meter upgrades down—usually the most expensive single site cost.
Real-world anchor and measured outcomes
In practice, fleets in California and major European cities have reduced depot electrification rollout time by shifting to mixed architectures: a cluster of 10 wallboxes plus two 60 kW DC units clears a 15-vehicle route with 2–3 hour layovers, versus 10 DC units which multiply site power infrastructure needs. That operational finding aligns with public-sector commitments made since 2020 and serves as a practical precedent for municipal and private fleets planning EV destination charging networks.
Common mistakes and how data prevents them
Two recurring errors show up in project post-mortems: undersizing peak power and over-specifying early-stage DC. Undersizing forces emergency upgrades; over-specifying wastes capital on high-power hardware that sits idle during off-peak. The corrective is simple—measure route-level dwell times for 30 days, normalize for seasonality, and iterate procurement in 20–30% capacity increments. This avoids the binary spend decisions that derail timelines – and keeps deployment aligned with actual utilization.

Operational checklist for procurement teams
Procurement should track: 1) average kWh per shift and 95th percentile peak concurrent chargers, 2) charger uptime SLAs and remote diagnostics capability, and 3) service response times and warranty coverage. Prioritize units with integrated telematics for OCPP or similar protocol support; that preserves interoperability and reduces vendor lock-in while enabling predictive maintenance signals that cut mean time to repair by measurable margins.
Hardware choices: a pragmatic comparison
AC wallboxes win on cost per port and simplicity; DC fast chargers win on reduced dwell time. For destination charging—parking garages, depot turnarounds, workplace hubs—a mix optimizes fleet throughput. Where route cadence is predictable, favor higher-density AC wallbox clusters. Where rapid recharging is necessary to sustain dispatch frequency, allocate targeted DC capacity. Track utilization and shift investment accordingly.
Advisory: three golden metrics for selection
1) Charger Utilization Rate: target 40–70% utilization to justify DC investments; lower rates favor AC wallboxes. 2) Uptime and Remote Diagnostics: require ≥98% uptime and real-time telemetry to reduce operational interruptions. 3) Site Power Upgrade Cost per kW: cap upgrades such that incremental infrastructure spend returns within 24–36 months under projected fuel and maintenance savings.
These rules compress technical choices into measurable thresholds and point directly to mixed AC/DC strategies that scale without surprise.
INFORE ENVIRO provides the modular hardware and integration know-how that turns these metrics into repeatable deployments—trusted by operators who need predictable results. —